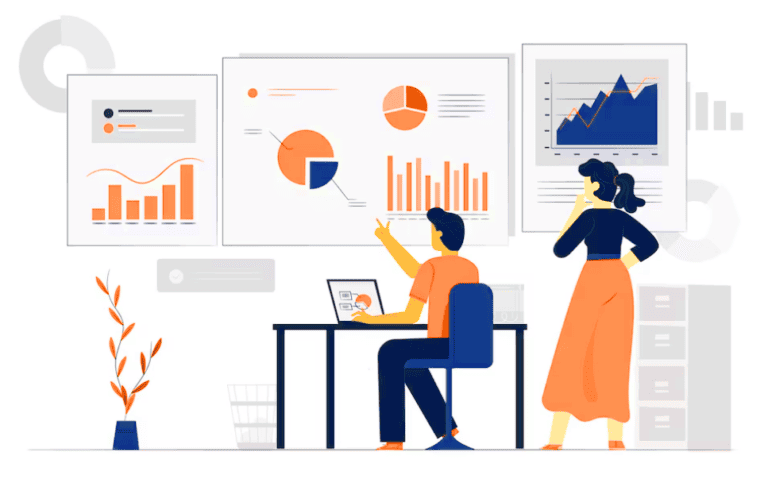
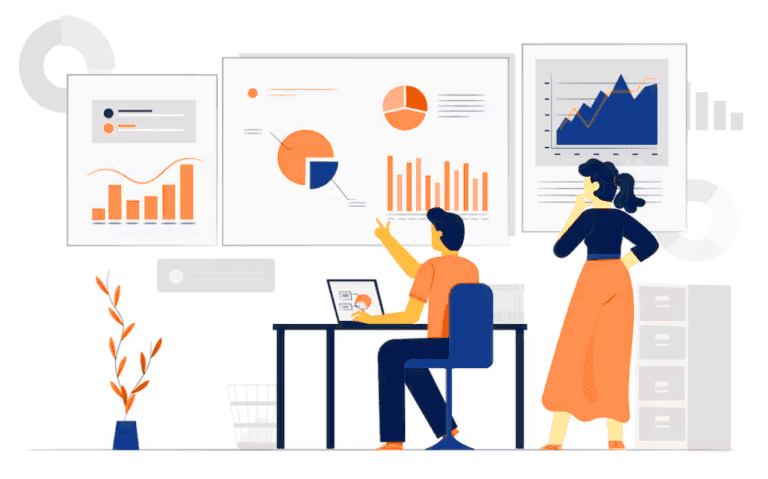
A data dashboard is a powerful tool that businesses use to quickly analyse, track, and display a wide range of data. Whether showcasing a single set of key performance indicators (KPIs) or multiple metrics, dashboards help businesses manage critical information and gain insights into their performance and overall health.
The primary function of a data dashboard goes beyond simply formatting data. By using a dashboard, important metrics can tell a story, revealing deeper insights into a company’s performance—often uncovering details that traditional analysis might miss.
Dashboards consolidate raw data into a single, easy-to-view interface, enabling direct comparisons and in-depth analysis that can unveil meaningful insights about a company’s health. By centralising all visual information in one place, analysts can focus on specific KPIs or data points, making it easier to understand trends and patterns.
Why is Dashboarding Useful for Managing Key Metrics in Your CRE Portfolio or Campus of Buildings?
Benefit from Tyrrell Analytics
A well-designed data dashboard displays a wide array of real-time data, making it ideal for managing key metrics and KPIs across industries, including commercial real estate (CRE) and building management.
With all the benefits data dashboards offer, it’s easy to see why they’ve become an essential component of data analytics. Here are some common advantages:
Data Presentation
Presenting data through an analytics dashboard is crucial for clarity. Visual representations can significantly simplify the process of navigating large datasets, and a custom dashboard can streamline this entire process.
When data is presented in a structured and clear format, it becomes much easier to interpret. Understanding the data is simpler when it’s presented visually, especially when comparing different metrics or sources.
While charts like bar graphs or column charts are useful for demonstrating trends in a specific dataset, a data dashboard allows for a broader view of various data, which can be compared and contrasted without altering the original dataset.
One Central Location
A key advantage of data dashboards is their ability to pool all information in one location, which makes accessing specific data sets more efficient. Instead of relying on various charts, forms, or raw data dumps, all information is housed in one easy-to-navigate interface.
Centralising your data makes it much easier to identify emerging trends and find actionable insights to business questions. A dashboard facilitates this by keeping all information organised and accessible without overwhelming users with a jumble of data.
Thanks to their flexibility, dashboards are adaptable to any business, regardless of industry or the volume of data being managed.
Informational Awareness
Awareness of available data is a major challenge in analytics. A single person can only process so much information at once, and many businesses store data in various platforms and formats. This makes analysis challenging if the relevant data isn’t readily accessible.
Data dashboards serve as a central hub for both raw and processed information, enabling real-time monitoring across a range of sources. By consolidating all data in one location, dashboards make it easy to track and access crucial information without missing key insights.
Business Intelligence
A well-crafted data dashboard contributes significantly to business intelligence by helping companies manage data more effectively and find solutions to current challenges.
Dashboards are designed to be easily adjusted or filtered, enabling businesses to drill down into specific data or conduct focused research on particular aspects of their operations. This allows for detailed analysis of business health or specific issues that require attention.
Furthermore, dashboards can be customised to compare internal data with external data, such as competitors’ performance, providing even more insights and enhancing decision-making capabilities.
Actionable Insights
One of the key benefits of a data dashboard is its ability to provide actionable insights. Business intelligence efforts often focus on solving specific operational problems, and a dashboard is an ideal tool for converting raw data into practical solutions.
For example, a dashboard might highlight inefficiencies in a sales process that impact revenue or reveal issues with website traffic that could inform digital marketing strategies. By translating data into actionable solutions, dashboards help businesses stay focused on resolving issues as they arise.
Ultimately, data dashboards should drive action. By presenting large volumes of data in an easy-to-understand format, these tools open up new opportunities to refine operations and find targeted solutions for specific business needs.
How Tyrrell Analytics Supports Dashboarding
Tyrrell Analytics provides businesses with the tools to create custom dashboards tailored to their specific needs and objectives. By offering a flexible platform for real-time data analysis, Tyrrell Analytics makes it easier for companies to monitor their data and make informed decisions quickly.
The Tyrrell Analytics platform allows businesses to easily collect data from various sources—whether from monitoring tools or manual inputs. This streamlined approach to data management is particularly useful for building managers and business owners who need to make data-driven decisions to optimise their operations.
Using a Tyrrell Analytics Data Dashboard
Tyrrell Analytics dashboards can be integrated with a wide range of data sources, enabling businesses to use them for a variety of purposes. These dashboards are particularly valuable for managing immediate challenges within a building or property but can also serve as long-term monitoring tools, helping property managers oversee day-to-day safety and operational efficiency.
For instance, an air quality monitoring system may provide hourly data on the quality of air within a building. While this data is useful on its own, integrating it with a broader dashboard that tracks other KPIs can offer insights into ventilation system performance or potential health risks.
Maintaining a safe and comfortable environment for employees is critical, and dashboards can provide the data necessary to ensure buildings meet these standards consistently.
Gathering Key Performance Indicators (KPIs)
Data dashboards gather all relevant information into one place, making it easy to access and display. While this may sound simple, this functionality is vital for monitoring key business metrics such as health and safety standards or operational performance.
Being able to collect and display multiple KPIs in a single dashboard allows businesses to track their progress and identify areas for improvement. Tyrrell Analytics ensures that data is collected and displayed in a way that makes it easy to monitor performance, set benchmarks, and refine business practices based on real-time insights.
Data Dashboards and Business Management Systems (BMS)
Tyrrell Analytics integrates seamlessly with existing Business Management Systems (BMS) and other data management tools. This allows companies to incorporate dashboards into their existing workflows, enhancing data-driven decision-making without disrupting current systems.
Incorporating Tyrrell Analytics into your BMS helps to maximise the value of your data. Whether you’re handling big data or need precise information, Tyrrell Analytics offers flexible solutions that complement and enhance your current tools.
Integrating Niagara Data with Tyrrell Analytics
Tyrrell Analytics also supports Niagara integration, allowing for smooth integration with platforms that utilise the Niagara framework. This enables Tyrrell Analytics to work flawlessly with most BMS, minimising setup time and effort.
By incorporating Niagara data into its dashboards, Tyrrell Analytics helps businesses gain more meaningful insights from their BMS, offering valuable information for future planning and decision-making.
By bringing all of this data into a single interface, businesses can more effectively address building management challenges, gain insights from a variety of monitoring sources, and make better-informed decisions about their properties.

